
Interactive analytics: From observation to exploration
Interactive analytics make visualizations useful
How interactive analytics changes the way IP professionals navigate patent data and the work they can do with it.
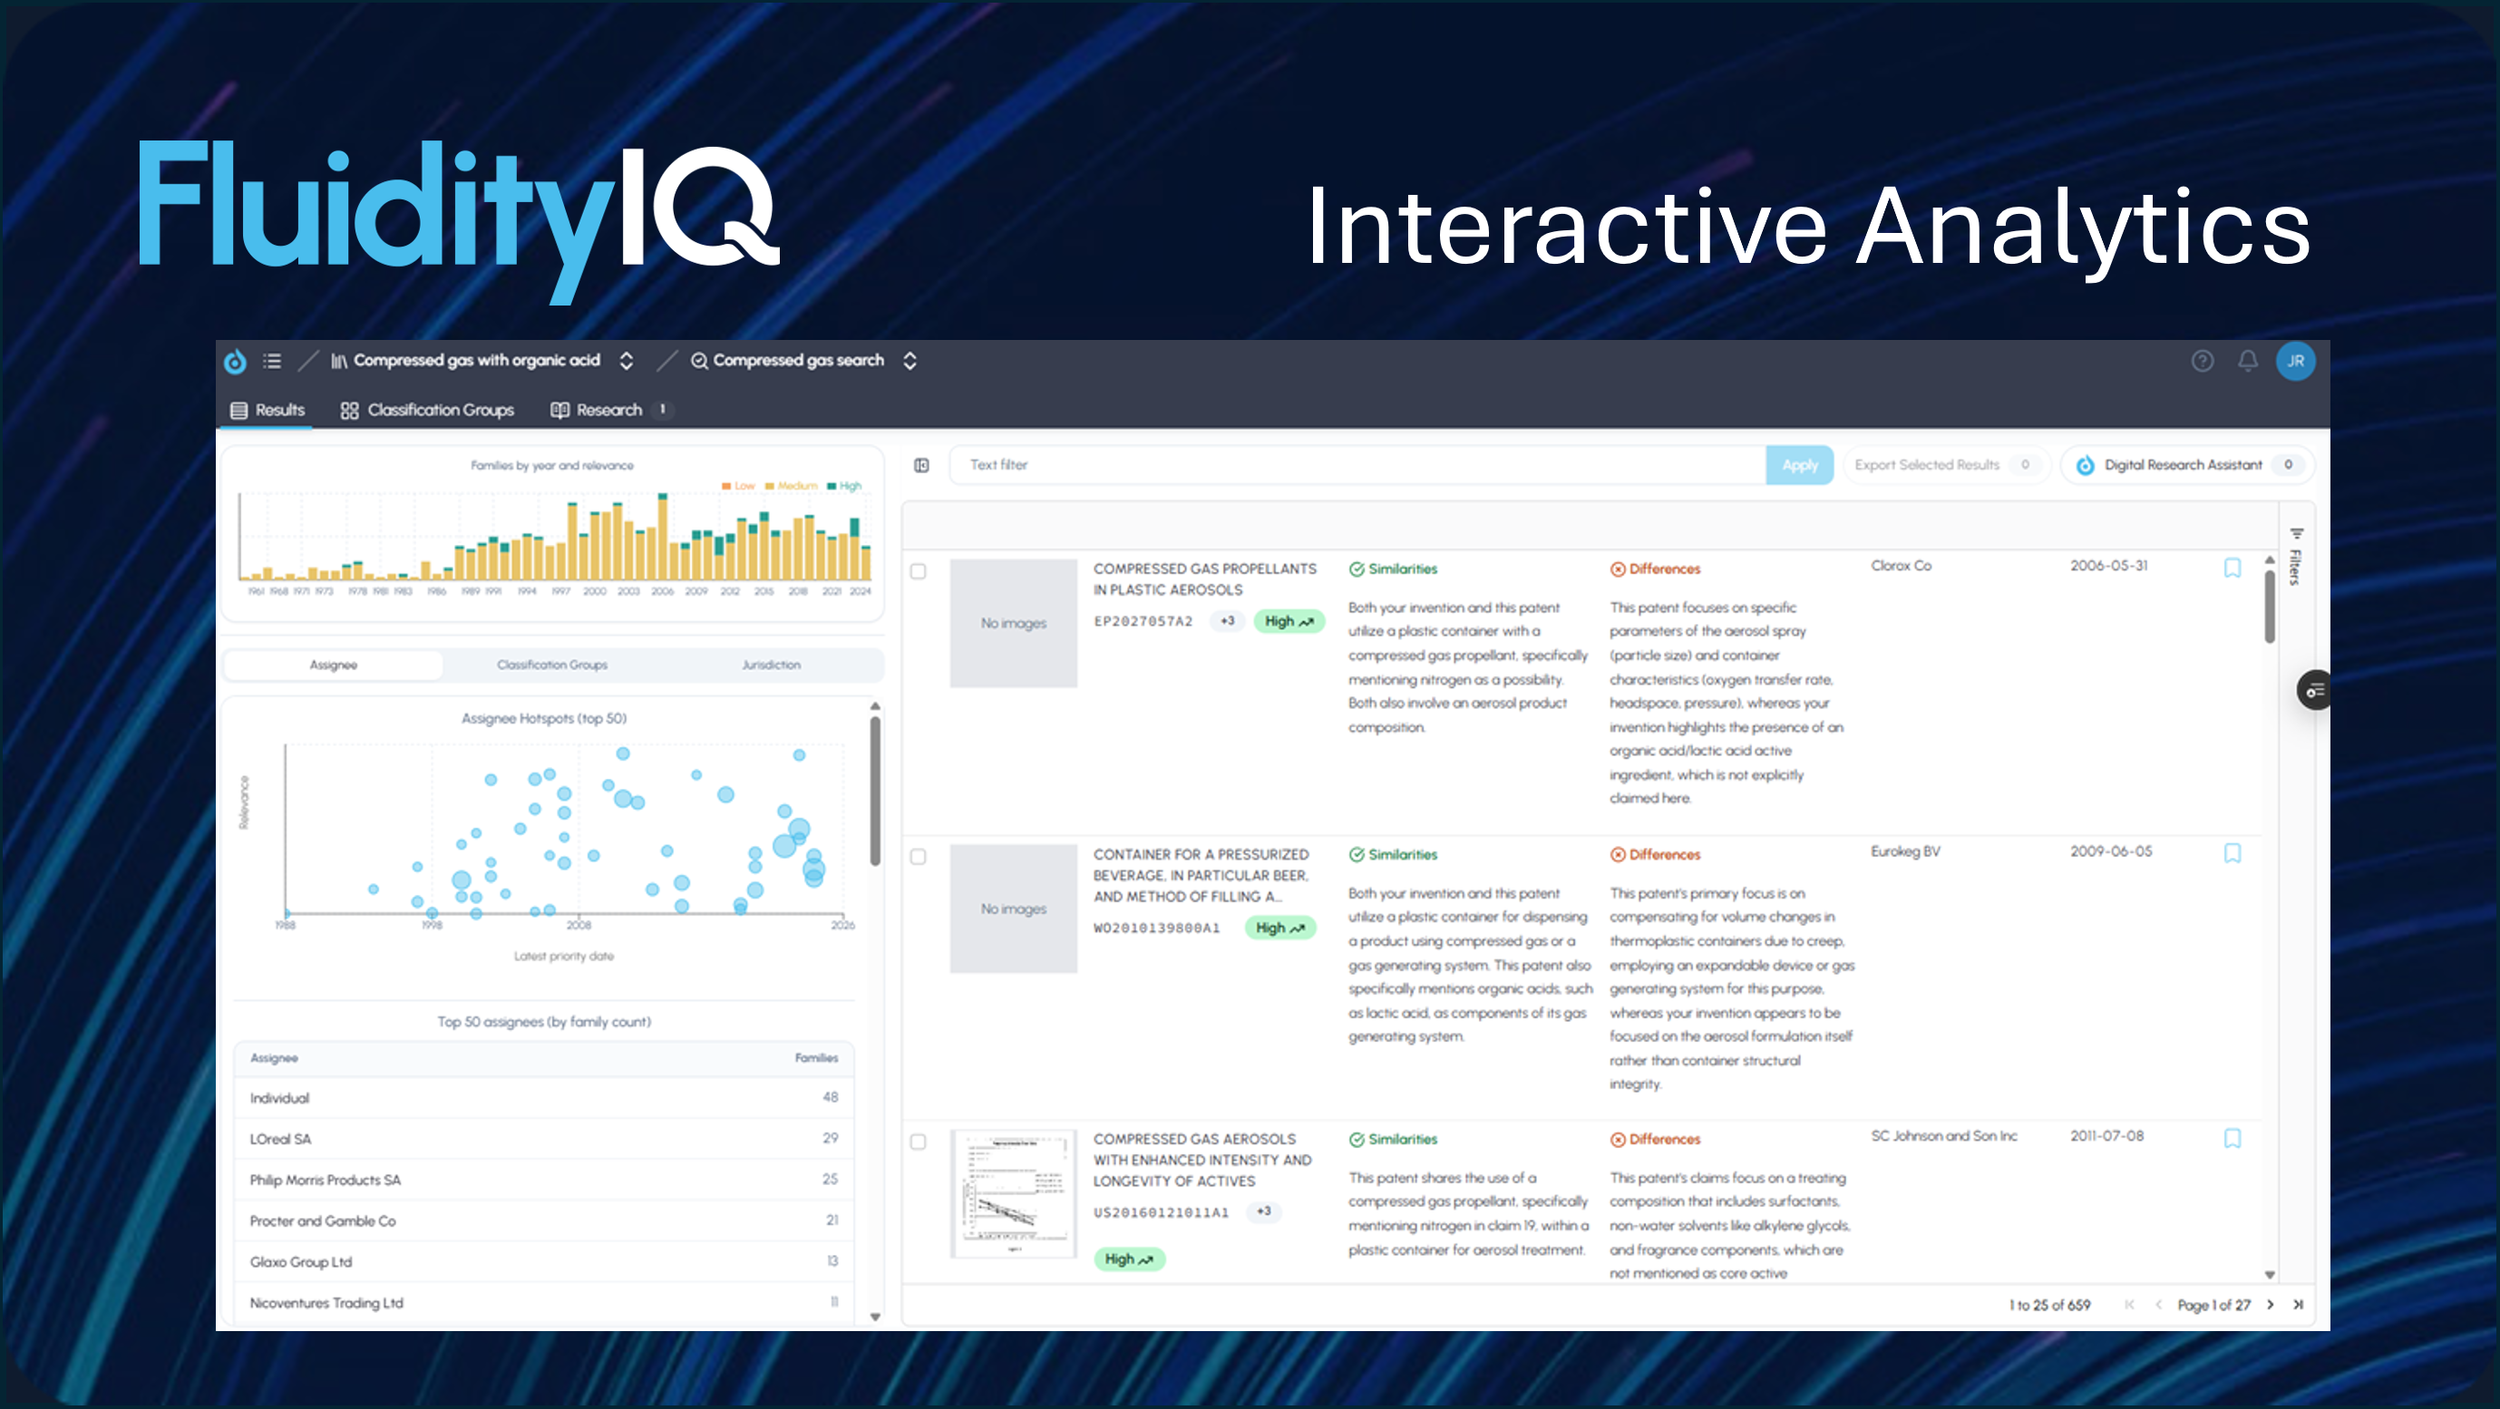
This week, FluidityIQ is releasing interactive analytics. This means that visualizations are no longer a summary layer sitting on top of your results. They are a navigation layer built into them. Click a technology cluster and your results filter to that cluster while every other chart on the panel updates simultaneously. Click an assignee, and the same thing happens. Stack the two filters together, and you are now looking at patents from that assignee within that cluster without leaving your search, without rebuilding your query, without touching a filter menu.
The shift from observation to navigation changes not just the experience of using the platform, but the nature of the work itself. Here is what that looks like across the IP use cases where it matters most.
Work that gets faster and deeper.
Competitive intelligence
Clicking into a technology cluster instantly filters results to those patents while the volumetric chart updates to show filing cadence within that specific cluster. What was a two-step inference now becomes a single gesture. An analyst can work through every relevant cluster in sequence, in one session, without rebuilding searches or losing context.
Freedom to operate
FTO work requires systematic coverage of the relevant patent landscape. The interactive assignee chart turns what was previously a visual summary into a navigation tool where you can click through each major assignee, review the filtered results within your search, and move methodically to the next. With stacked filtering, you can combine an assignee filter with a cluster filter to focus analysis on the specific technology domain that matters for clearance, without rebuilding your search or losing your place.
As you work through assignees and clusters, bookmarking relevant patents sends them directly to your Private Innovation Library. Once your review is complete, the PIL's charting feature analyzes the claims across your bookmarked set, extracts the unique technical features described across those claims, and maps each patent against each feature giving you a structured comparison matrix that organizes the landscape for further analysis.
The older model required trusting that manual review had caught everything within a result set. The new model lets you structure that review, walk through it systematically, and carry the output directly into claims analysis.
White space analysis
White space work requires looking for what is absent. Filter by a technology cluster, watch the volumetrics, and look for filing gaps — thin years, clusters present in adjacent searches but missing here, assignees active elsewhere who have no presence in this domain. The interactivity lets you probe edges and absences, not just observe density at the center.
Structured prior art collection
Combined with FluidityIQ’s bookmarking and Private Innovation Library (PIL), interactive analytics enables a structured collection workflow that didn’t exist before. Click a cluster, review filtered results, bookmark the relevant patents. Click the next cluster, repeat. Every bookmarked patent lands in the PIL — including across different searches run in separate sessions. The result is a curated prior art set built through deliberate navigation rather than keyword guessing.
Investment and due diligence
For anyone evaluating an acquisition target or investment thesis, the key question is rarely how many patents an entity holds — it is where the meaningful technical depth is concentrated. Clicking through a target’s technology clusters, watching results filter in real time, and stacking an assignee filter to isolate a specific entity’s contribution within a shared technology space answers that question directly. What previously required analysis workflows outside the platform can now happen as a live analytical session inside it.
The underlying principle
The common thread across all of these use cases is the collapse of distance between observation and action. Traditional analytics architecture separates the visualization layer from the document layer — you read the chart, form a hypothesis, leave the chart, refine the search, come back to the chart. Every round trip costs time and context.
Interactive analytics fuses those layers. The analyst never leaves the context of the search. The chart is not a summary of what they found, it is a tool for deciding what to look at next.
Contact us at info@fluidityiq.com to discuss how integrated analytics can enhance your current workflow.