
Building a claims chart with FluidityIQ
A step-by-step guide for building interactive claims charts
A claims chart is the foundational tool of applied patent analysis. Whether you are assessing freedom to operate before a product launch, evaluating a competitor's portfolio, preparing for licensing negotiations, or challenging a patent's validity, the claims chart is how abstract claim language gets mapped to something real: a product, a process, a prior art reference, or an emerging technology. It structures the analysis element by element, creating an auditable record of where coverage exists and where it does not. In the FluidityIQ platform, building a claims chart starts with assembling a focused corpus of relevant patent families through semantic search, then directing the Deep Research Agent to perform the element-by-element mapping, using either features you define or the specific language of an existing claim as the analytical baseline.
Build a corpus of relevant art to interact with
Begin by developing a search strategy using natural language to capture the essential features of the patent or invention you wish to evaluate, regardless of the outcome you seek. FluidityIQ allows you to enter the details of an innovation into the Invention Description field and set relevant criteria. This process generates a corpus of the 1,000 most relevant patent families for review, helping you focus on the most pertinent prior art (see below).
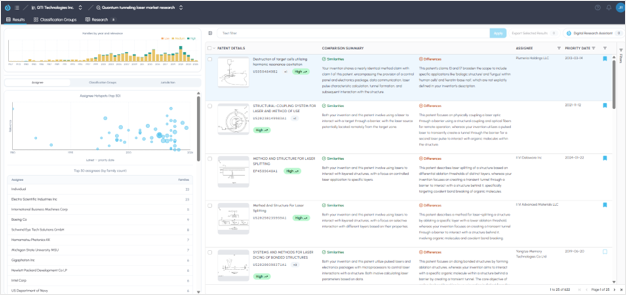
Using semantic searching to build an interactive corpus of patents
Use the Deep Research Agent to build a claims chart
Click on the Research link in the upper left to access the Deep Research Agent.
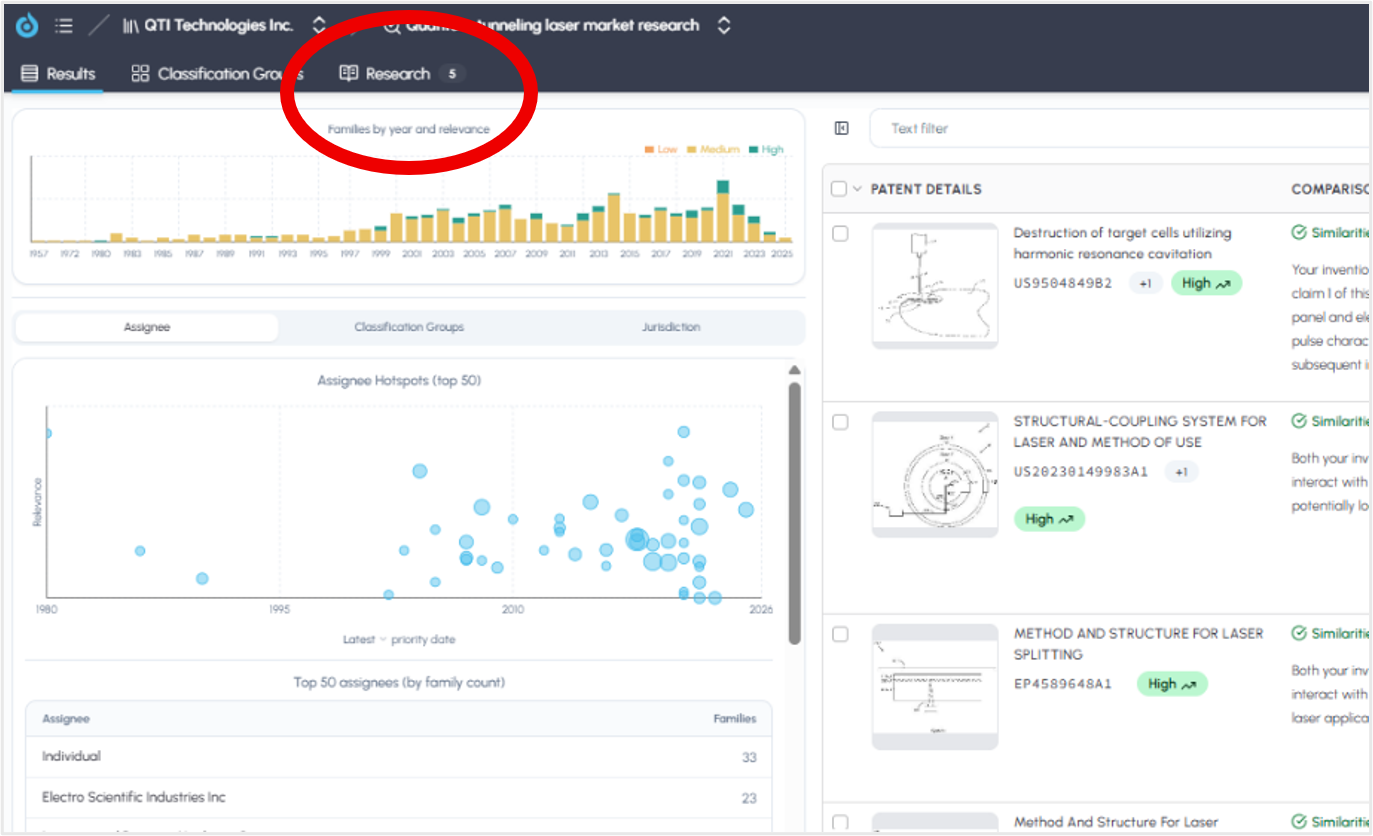
Access the Deep Research Agent to build claims charts ad more
Once in the Deep Research Agent, simply provide the agent your specific instructions using natural language by typing your instructions in the box at the bottom of the page where it says Send a message….
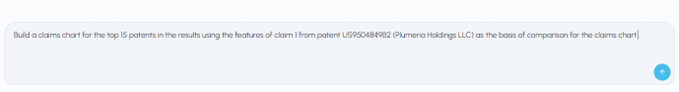
Interact with the Deep Research Agent using natural language.
The Deep Research Agent has access to the full text of the top 1,000 patent families included in your search results. It will take up to five minutes for this analysis to be completed. Once completed, a titled and date-stamped report will become persistently available in the panel on the left.
Each report will include the following components:
a. Executive Summary
b. Description of Scope and Methodology
c. Comparative Feature Matrix (Claims Chart)
d. Conclusion
e. Sources Links
The user will have the ability to copy each report to a clipboard for use in other documents or print a clean pdf version of the report.
Click here to view a sample pdf report.
Conclusion
Claims charting has traditionally been a time-intensive manual process, requiring practitioners to work through claim language line by line against a set of references. FluidityIQ compresses that workflow significantly. By combining a semantically ranked corpus with a research agent that understands natural language instructions, you can move from a search strategy to a structured, sourced claims analysis in a single session. Whether you are conducting a freedom-to-operate review, building an infringement narrative, or mapping a competitive landscape, the output is the same: a clear, organized record of where claim elements find support in the prior art and where they do not. The ability to anchor the analysis to either user-defined features or the specific language of an existing claim gives practitioners the flexibility to tailor the chart to the task at hand, without rebuilding the workflow from scratch each time.
To learn more contact a representative at sales@fluidityiq.com.